County health rankings released
Published 11:06 am Wednesday, March 21, 2018
The 2018 County Health Rankings and Roadmaps report has been issued by the University of Wisconsin Population Health Institute and the Robert Wood Johnson Foundation.
The 2018 County Health Rankings and Roadmaps report is based on this system. (countyhealthrankings.org)
In the report, Dare and Currituck counties placed in the top ten among North Carolina’s 100 counties in Health Outcomes. Dare ranked 6 and Currituck 7.
The two counties are also close to the top in Health Factors assessment.
Dare County is now in the top ten, with a ranking of 7. Currituck placed 19.
For Hyde, the ranking for Health Outcomes is 23 and for Health Factors, 74. For Tyrrell, the Health Outcomes ranking is 83 and Health Factors 90 out of 100 counties.
The Rankings and Roadmaps document is a compilation of reports from numerous sources and provides an overview of the health of the nation, states and counties.
Behind the report is premise that “health is more than what happens in the doctor’s office.”
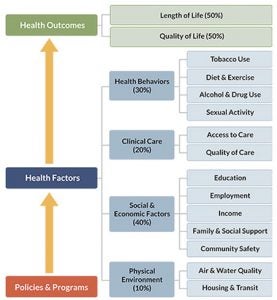
The report, which can be found at countyhealthrankings.org, features the two big areas: Outcomes and Factors. The Health Factors portion is subdivided into four areas with a dozen different focus topics with 30 health factors evaluated.
The reports are “rooted in a deep belief in health equity, the idea that everyone has a fair and just opportunity to be as healthy as possible, regardless of race, ethnicity, gender, income, location, or any other factor,” states the introduction.
The key findings report that over the decade the County Health Rankings have shown that where people live makes a difference.
This year, says the report, the analyses find “meaningful health gaps persist not only by place, but also by race and ethnicity. These gaps are largely influenced by differences in opportunities – from a lack of access to quality health care to a lack of safe, affordable housing – that disproportionately affect people of color.”
The Rankings are based on summary composite scores calculated from individual measures. The online report gives the county rankings for each of the outcomes and four Health Factors categories as well as the raw data for the 30 measures used in the Health Factors section.
Overall Health Outcomes
Length of Life (50%). Focus: Premature Death. Measure: Years of potential life lost before age 75 (50%)
Quality of life (50%): Poor or fair health (10%), poor physical health days (10%), Poor mental health days (10%), Low birthweight (20%)
Health Factors for County Summaries
Four health factor areas are separated into 12 focus areas with 30 measures
-Health behaviors (30%)
Smoking (10%). Measure: Adult smoking (10%)
Diet and exercise (10%). Measures: Adult obesity (5%), Food environment index (2%), Physical inactivity (2%), Access to exercise opportunities (1%)
Alcohol and drug use (5%): Measures: Excessive drinking (2.5%), Alcohol-impaired driving deaths (2.5%)
Sexual activity (5%): Measures: Sexually transmitted infections (2.5%), Teen births (2.5%)
-Clinical care (20%)
Access to care (10%): Measures: Uninsured (5%), Primary care physicians (3%), Dentists (1%), Mental health providers (1%)
Quality of care (10%): Measures: Preventable hospital stays (5%), Diabetes monitoring (2.5%), Mammography screening (2.5%)
-Social and economic factors (40%)
Education (10%): Measures: High school graduation (5%), Some college (5%)
Employment (10%): Unemployment (10%)
Income (10%): Measures: Children in poverty (7.5%), Income inequality (2.5%)
Family and social support (5%): Measures: Children in single-parent households (2.5%), Social associations (2.5%)
Community safety (5%): Measures: Violent crime (2.5%), Injury deaths (2.5%)
-Physical environment (10%)
Air and water quality (5%): Measures: Air pollution – particulate matter (2.5%), Drinking water violations (2.5%)
Housing and transit (5%): Measures: Severe housing problems (2%), Driving alone to work (2%), Long commute – driving alone (1%)
More News


-
Polls
 Loading ...
-
-